Volatility. It’s a business reality for energy market participants and it’s been a wild ride for the oil marketing business over the past few weeks. How has your energy risk data helped you navigate the recent increase in volatility and precipitous price drop?
This month, we are launching a recurring simulation exercise nicknamed VirtualOil. This is a fictitious portfolio that readers can use as a generic benchmark to compare against their own physical oil commodity book’s performance. Each month we’ll update the VirtualOil portfolio and reflect on what the visual analytics (shown below) can tell us about energy risk management.
What exactly is VirtualOil? It’s a hypothetical derivatives-based oil production firm, which simulates the performance of a generic crude oil asset and delivers sectorial exposure to the commodity oil market. Specifically, the VirtualOil structure:
- Starts up with an investment of $350 million in monthly average price call options with a strike price of $50 a barrel on the price of West Texas Intermediate (WTI) light sweet crude oil.
- The strip of options starts at 10,000 barrels per day and extends out for 5 years with a 20 percent average annual decline in underlying notional barrels, replicating a physical oil asset.
- VirtualOil initially holds notional crude oil reserves of approx. 10 million barrels.
- Monthly cash flow is generated when the daily average WTI price relative to the preceding month exceeds $50 per barrel.
- Cash flow is reinvested monthly at 5 percent and the project winds up when the reserves are depleted.
To get started, we looked at how the hypothetical VirtualOil portfolio would have performed over the past five years by crunching that very large set of numbers and calculations in SAS® BookRunner and surfacing it in SAS® Visual Analytics. The result is a single chart that represents both Mark-to-Market (MtM) and Value-at-Risk (VaR), at the barrel level, of the rolling five-year portfolio.
Chart: Rolling Five-Year Portfolio
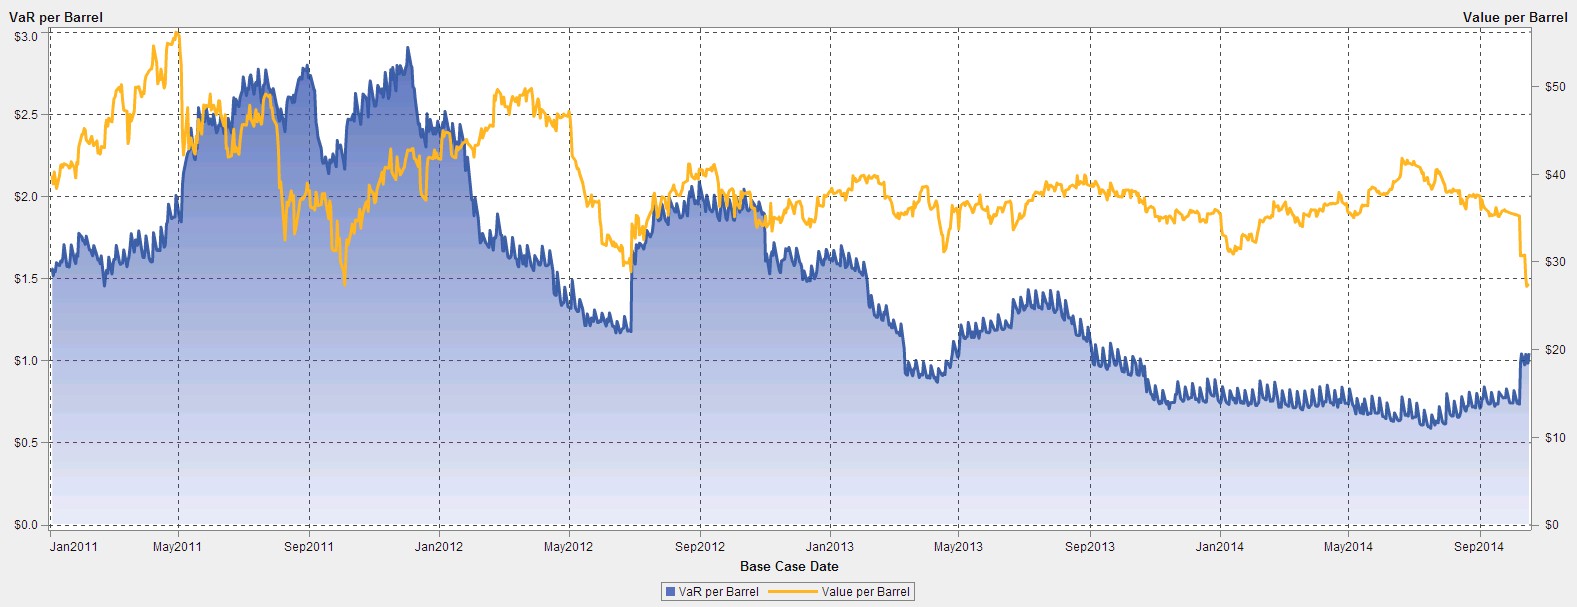
We can see that volatility has dropped over the five-year period, so the portfolio’s VaR has also declined. However, as the chart shows, prices have taken a steep drop in the last couple weeks, and VaR has jumped. The current MtM of the five-year rolling portfolio is now at a five-year low. The previous low was Oct 4, 2011, but VaR at that time was double its current level. Insightfully, short positions are likely to have gained relatively more from this current drop, as they may have had over twice the position room in their VaR limits.
We can continue our investigation of the data in SAS Visual Analytics by viewing the performance of portfolios of other vintages over the last five years. They clearly illustrate how risk drops as production declines, leaving cash in-hand. Take a look at the series of annual vintage charts below.
Chart: Jan 2011 Start-Date Portfolio
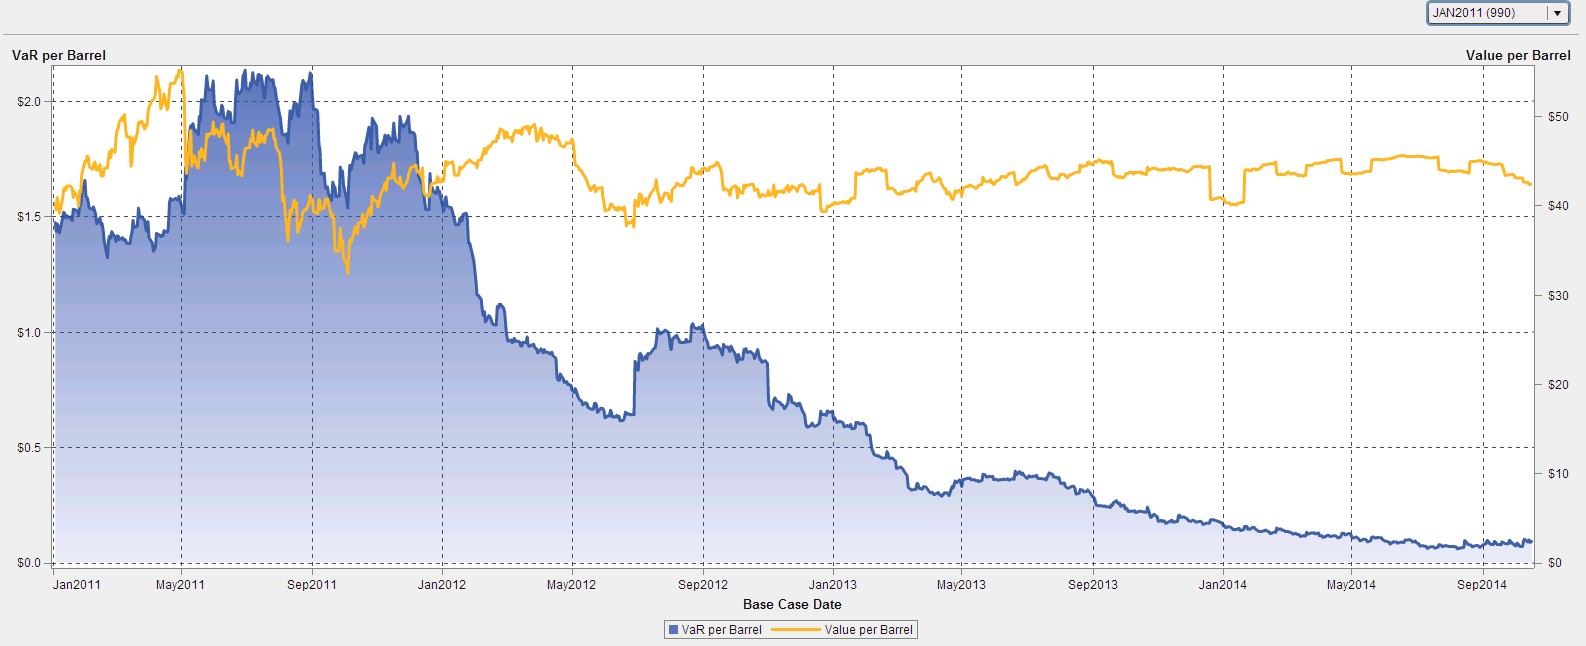
Chart: Jan 2012 Start-Date Portfolio

Chart: Jan 2013 Start-Date Portfolio
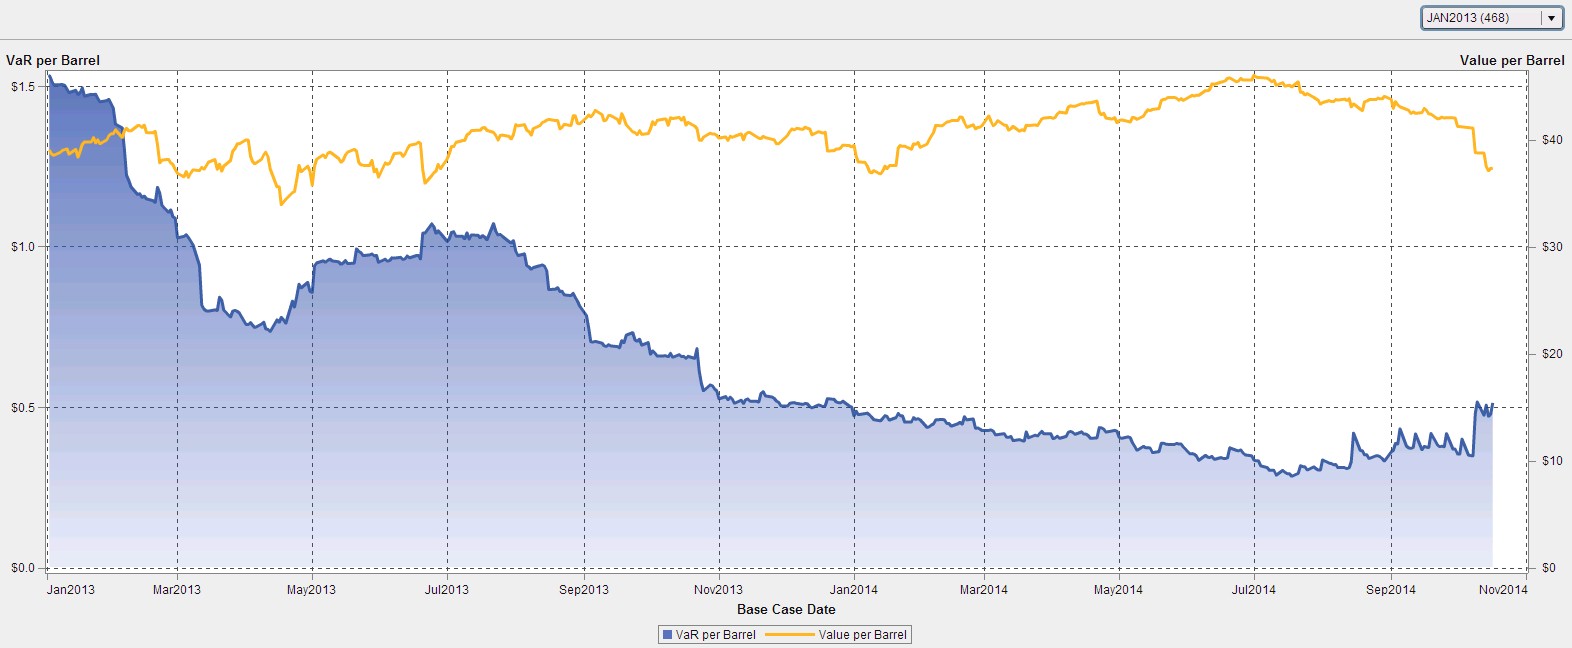
Chart: Jan 2014 Start-Date Portfolio
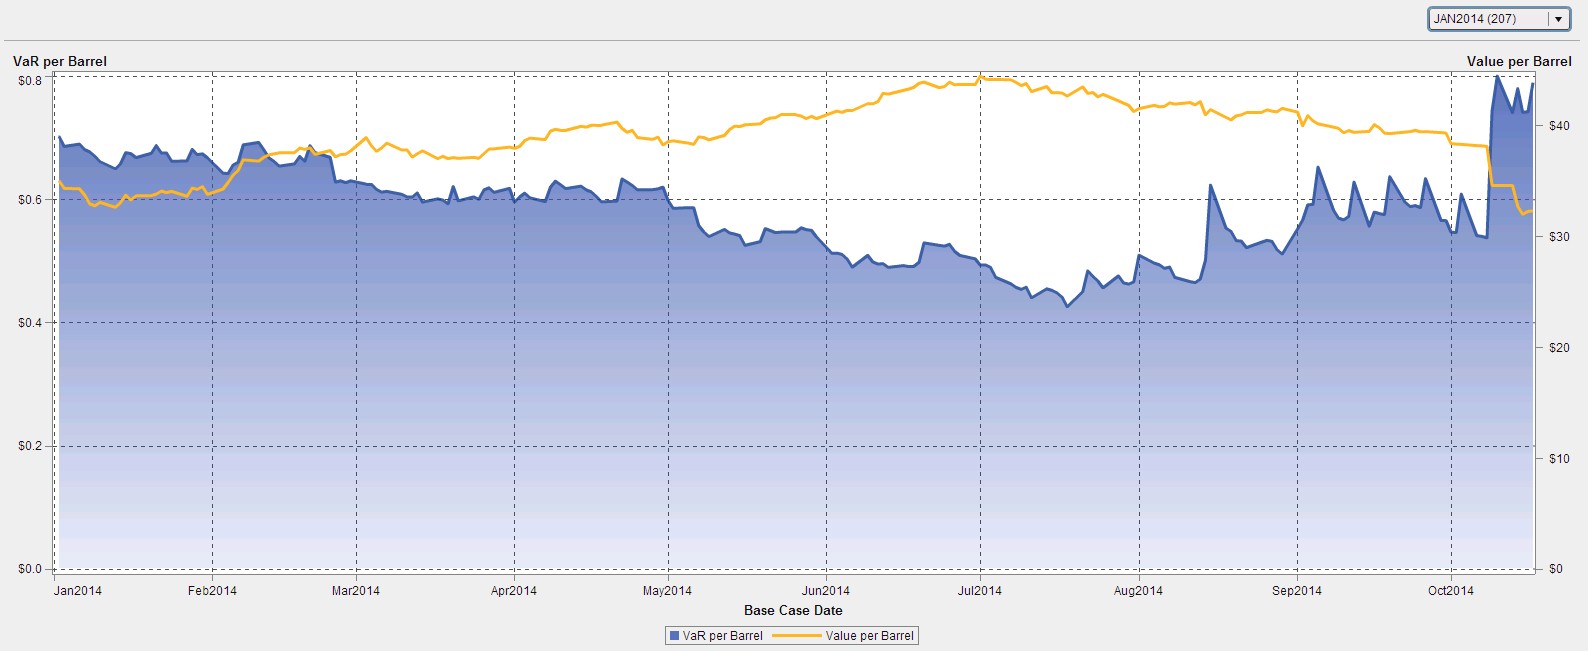
These granular views also allow us to compare profit over different time frames and, as the portfolio settles out, determine an average profit on a well. For instance, we see that a well drilled in volatile 2011 has captured an overall Mark-to-Market value of $42 per barrel, whereas a well drilled in 2013, in a lower-priced and less volatile market, achieves about $37 per barrel. The rolling portfolio, meanwhile, shows that a well coming online today achieves $27 per barrel in a much less volatile market where options hold less value.
Join us here each month to see how VirtualOil is performing and how the energy risk analysis is evolving.
You can also learn more about SAS BookRunner’s state-of-the-art energy trading & risk management capabilities now.
Disclaimer: This is a fictitious portfolio and is not a solicitation to trade.